SOCIB RAMADDA Data Repository
Map and Time Series Displays
Previous: Point Data Services Next: Data Subsetting and Conversion Table of contents
Point Data Documentation
 
1 Map and Time Series Displays
When you are viewing a LiDAR data file entry (e.g., LVIS Costa Rica) choose the LiDAR Data->LiDAR Map and Chart menu for an interactive map and timeseries chart of the data. If the LiDAR data file contains waveforms (as the example above does) there will also be an image of the waveform for a given point displayed.
LiDAR Map and Chart
Image 1: LiDAR Map and Chart
Clicking on the time series image will show the approximate location in the map of that point in the LiDAR data and will also create and show the waveform at that point.

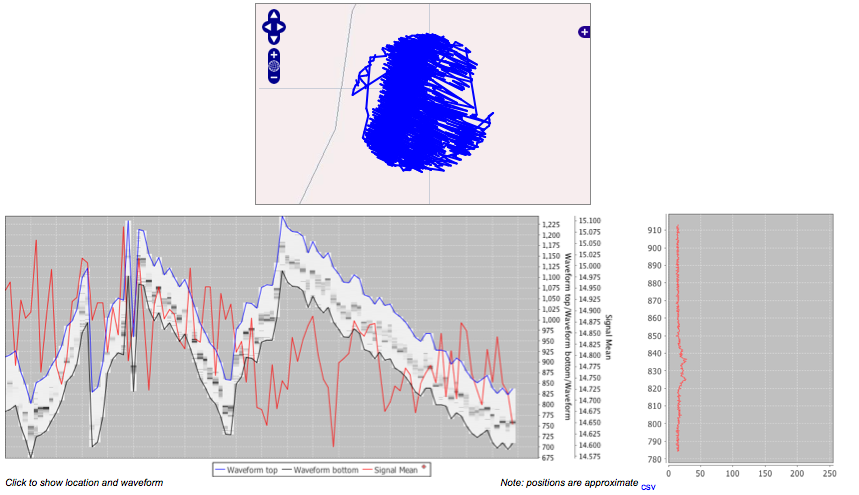
Note: because the time series image is generated from a sub-sampling of the actual data the mapping and is limited in size (e.g., 800 pixels vs. 20 million points) the positions are only approximate.

The CSV link will give a CSV file of the displayed waveform.

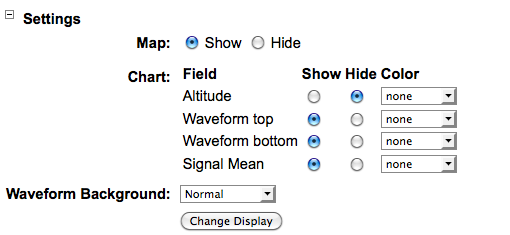
The Settings section allows you to hide the map and choose other fields to display in the time series:

Chart Settings
Image 2: Chart Settings
The Waveform Background menu allows you to show the waveform fully expanded to the size of the time series chart. Normally the waveform is shown at the actual height as measured.


Previous: Point Data Services Next: Data Subsetting and Conversion Table of contents

Powered by Geode Systems and RAMADDA